
Creating flowcharts used to mean dragging boxes around for hours, cursing at alignment tools, and starting over when you realized your logic was backwards. Now you can describe your process in plain English and have an AI turn it into a polished, visually engaging flowchart in minutes.
Why This Actually Works
Here’s the thing about flowcharts—they’re just visual representations of logical sequences. LLMs are surprisingly good at understanding logical sequences and translating them between different formats.
This is an excellent way to save time the next time you need to produce a flow chart, likely for work. This combines an LLM’s ability to break down processes with modern AI visualization tools like napkin.ai, or traditional diagram tools like draw.io. Instead of wrestling with design software, you focus on the logic and let the tools handle the visuals.
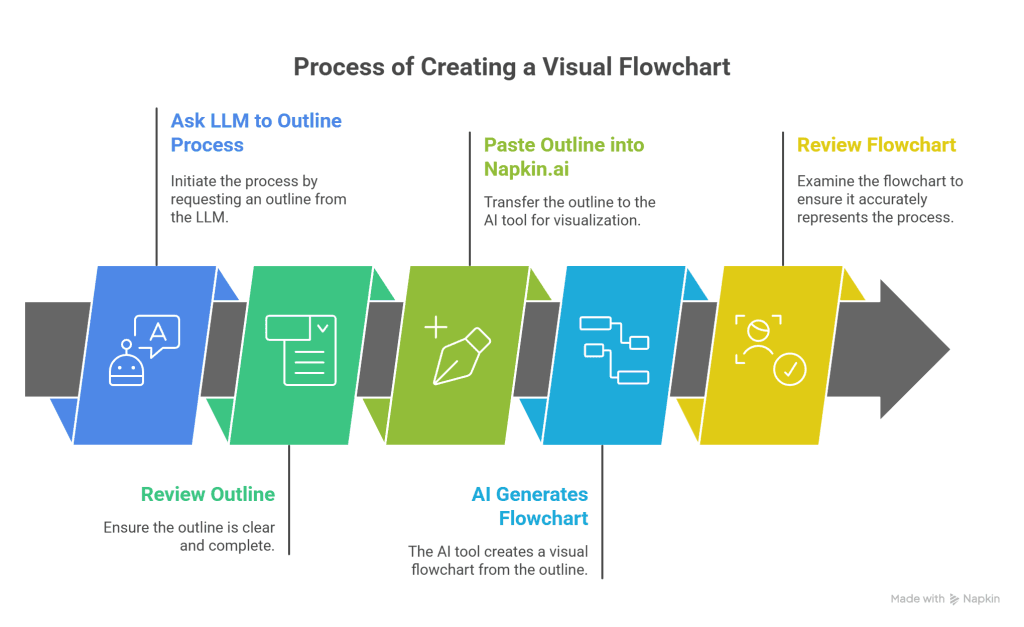
Step 1: Ask the LLM to Outline Your Process
Start by having the AI break down whatever you’re trying to flowchart. Be specific about what you want mapped out.
Instead of: “Help me make a flowchart for customer onboarding.”
Try this: “I need to map out our customer onboarding process. It starts when someone signs up for our free trial, includes email verification, account setup, and ends when they either convert to paid or cancel. Can you outline the key steps and decision points?”
The LLM will give you a structured breakdown that looks something like:
- Customer signs up for free trial
- System sends verification email
- Decision point: Did they verify their email?
- If yes: Account setup begins
- If no: Send reminder emails (with limits)
And so on. This step is crucial—don’t skip it. A good outline makes everything else easier.
Step 2: Ask for a Flowchart Based on the Steps
Once you have your outline, ask the AI to convert it into flowchart format. This means thinking in terms of shapes and connections.
Prompt example: “Take that outline and convert it into a flowchart structure. Show me what shapes would represent each step (rectangles for processes, diamonds for decisions, etc.) and how they connect to each other.”
The AI will describe something like:
- Start (oval): “Customer signs up”
- Process (rectangle): “Send verification email”
- Decision (diamond): “Email verified?”
- And the connections between them
This gives you a chance to catch any logic issues before moving to the visual stage.
Step 3: Request Mermaid Code
Now for the technical bit. Mermaid is a simple text-based way to describe diagrams that tools like draw.io can automatically render.
Ask the AI: “Convert this flowchart structure into Mermaid code.”
You’ll get something that looks like this:
flowchart TD
    A[Customer signs up] --> B[Send verification email]
    B --> C{Email verified?}
    C -->|Yes| D[Begin account setup]
    C -->|No| E[Send reminder email]
    E --> F{Reminder limit reached?}
    F -->|No| E
    F -->|Yes| G[Mark as inactive]
    D --> H[Complete onboarding]
Don’t worry if this looks like code—you don’t need to understand it. Just copy it.
Step 4: Copy the Code
Highlight all the Mermaid code and copy it to your clipboard. Make sure you get everything from the first line to the last.
Pro tip: If the code looks incomplete or the AI cut it off, ask it to “show me the complete Mermaid code again” rather than trying to piece it together yourself.
Step 5: Choose Your Visualization Tool
You’ve got two solid options here, depending on what kind of flowchart you want:
Option A: napkin.ai (Recommended for Most Use Cases)
Head to napkin.ai for the most AI-powered approach. Instead of using the Mermaid code, go back to your original outline from Step 1.
Simply paste your outline into napkin.ai and let it work its magic. The AI will automatically create a visual flowchart that’s more colorful, engaging, and often easier to understand than traditional box-and-arrow diagrams.
Why this is better: napkin.ai doesn’t just render your logic—it makes design decisions about colors, layouts, and visual hierarchy that actually improve comprehension.
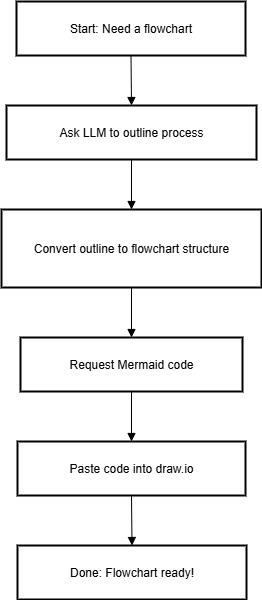
Option B: draw.io (Best for Simple, Professional Diagrams)
If you need something more traditional, black-and-white, or corporate-friendly, stick with draw.io, which redirects to https://app.diagrams.net/.
Here’s how to use your Mermaid code:
- Click Arrange > Insert > Mermaid in the menu bar. Alternatively, click the
+icon in the toolbar, then select Mermaid. - Paste your Mermaid code into the text box that appears, then click Insert.
Your diagram will be automatically created and formatted, appearing as a single shape on the drawing canvas that you can move, resize, or modify.
When to use draw.io: Technical documentation, formal business processes, or anywhere you need that clean, minimal look.
What You Get (And Why It’s Better)
The difference between these approaches is immediately obvious when you see them side by side.
With napkin.ai, you get flowcharts that don’t just function—they actually engage people. Look at how the AI chose different colors for each step, added relevant icons, and created a flowing visual narrative. It’s like having a designer and a flowchart expert working together.
With draw.io, you get clean, professional diagrams with perfect alignment and routing that would take ages to create manually. The automatic formatting handles spacing and connections flawlessly—perfect for when you need something that fits corporate standards or technical documentation.
Either way, since you started with an AI outline, your logic is typically cleaner than if you’d just started dragging boxes around. You thought through the process first, then visualized it.
Common Mistakes to Avoid
Don’t skip the outline step. Jumping straight to “make me a flowchart” usually results in something generic or incomplete. The outline forces you to think through edge cases and decision points.
Don’t assume the first result is perfect. Whether you’re using napkin.ai or draw.io, if your flowchart looks wrong, go back to the AI and refine your outline or ask for Mermaid code adjustments. Both tools are only as good as the logic you feed them.
Don’t try to hand-edit Mermaid code unless you know the syntax. If something needs changing, describe what you want to the AI instead of trying to modify the code yourself.
When This Method Shines
This approach works particularly well for:
- Business processes with clear decision points
- Troubleshooting workflows
- User journey mapping
- Project planning with dependencies
- Any process where you can describe “if this, then that” logic
It’s less useful for highly technical diagrams, network architectures, or anything requiring precise measurements or specialized symbols.
The Bottom Line
You just turned a potentially hours-long design task into a 10-minute conversation with an AI. The flowchart you get is cleaner, more logical, and easier to modify than most people create the traditional way.
Next time you need to map out a process, remember: describe it clearly, let the AI structure it, and let draw.io make it pretty. Your brain is better used on the logic than the layout.